Monogenic Signal and Scale-Space
Download: source code version 2.0 beta 4 (Matlab, GPL)
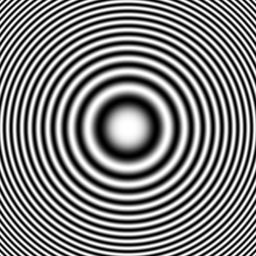
Consider an image:

Image 1 Synthetic test image
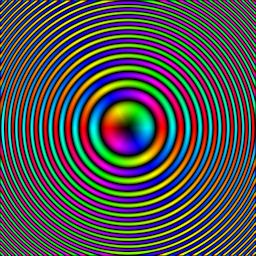
If we compute the Poisson scale-space of the image (click on image 1 to watch image sequence), we implicitly define an image flux. In case of the Gaussian scale-space, the image flux is given by the gradient field of the image. For the Poisson scale-space, the image flux is obtained from theRiesz transform (generalization of the Hilbert transform) of the image:

Image 2 Image flux (Riesz transform) of image 1
The image flux is visualized in a color-intensity coding: The color corresponds to the vector orientation and the intensity to its magnitude. To see the full flux evolution through scale-space, klick on image 2.
The concept of looking at the evolution of the image and its flux through (Poisson) scale-space is called the monogenic scale-space.
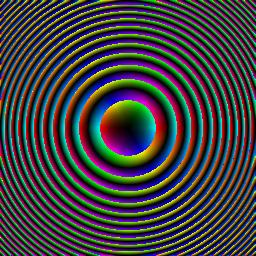
The image and its flux at a certain scale form the monogenic signal, a multi-dimensional generalization of the 1D analytic signal. Similar to the 1D case, we define a local amplitude by the vector norm of the monogenic signal (a 3D vector). For practical and theoretical reasons, it is most convenient to consider the logarithm of the local amplitude, the local attenuation:

Image 3 Local attenuation (log of amplitude)
For displaying, the logarithm is normalized, i.e., it is nearly one everywhere (as it should). To see the evolution of the local attenuation through scale-space, klick on image 3.
Instead of defining a local phase for the monogenic signal, it is more convenient to consider thelocal phase-vector:

Image 4 Local phase vector
The phase-vector is visualized in a color-intensity coding: The color corresponds to the phase-vector orientation and the intensity to its magnitude. The evolution of the phase-vector through scale-space is shown by klicking on image 4.
Doing some simple math, it is possible to show, that the phase-vector orientation represents thelocal orientation of the image and that its magnitude corresponds to the local 1D phase of the projection along the local orientation.
Doing some more math, a further, very interesting result is obtained: local attenuation and local phase-vector form again a monogenic scale-space! This important relationship and the previously introduced material has a large impact on several applications in image processing, e.g., edge detection, orientation estimation, local frequency estimation, disparity estimation, etc. Please refer to the publication list or contact Michael Felsberg.
Last updated: 2016-01-15
 LiU startsida
